How to Visualize the Length of Time for the Sales Funnel
Are your leads stuck in your sales funnel for too long? What is the best way to actually see how long each stage takes before conversion?
By finding a way to visualize how long prospects spend in each stage of the funnel, you can spot unseen delays, compare performances over time, and clearly check where improvements are needed.
This article explains the key metrics that make funnel timing visible, the most effective visualization techniques, and step-by-step processes to find a way to visualize funnel length.
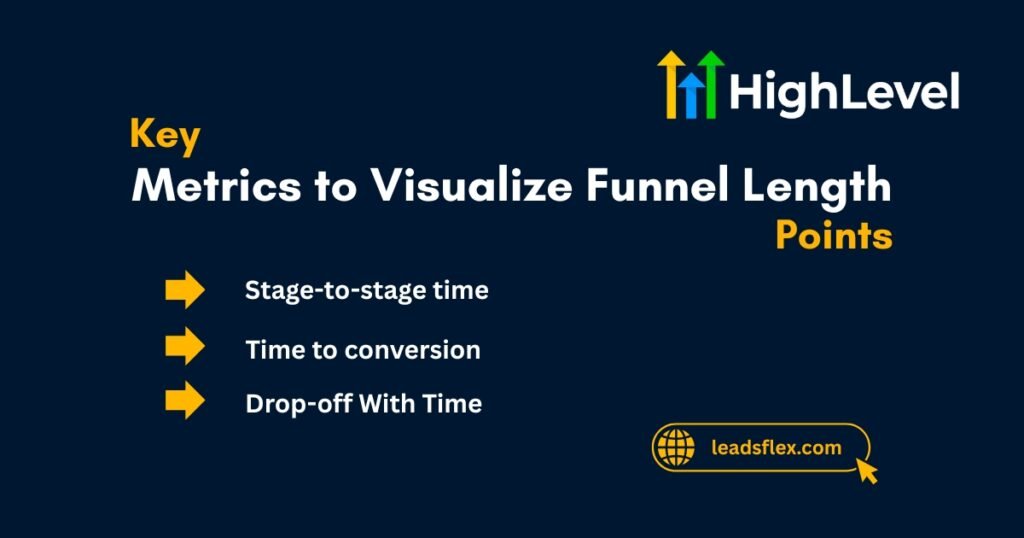
Key Metrics to Visualize Funnel Length
The following are key metrics to visualize funnel length and conversion speed:

Stage-to-stage time
The first metric is stage-to-stage time, which measures the time spent in each stage, such as the time spent transitioning from Awareness to Interest, from Interest to Decision, and from Decision to Action.
Time to conversion
This metric measures the total time from entry to conversion. It tracks time in a particular period, such as conversions, within a week, two weeks, a month, or three months.
Drop-off With Time
It measures the number of leads that drop out at each funnel stage and the average time they waited before leaving. This shows at which stage time delays are costing you.
Bottleneck Detection
The metric tracks which stage consistently takes the longest time to complete. Spotting bottlenecks helps focus on where leads slow down most.
Read this: GoHighLevel Real Estate Funnels – Professional Solutions for Luxury Agents
Visualization techniques
The following are the visualization techniques to make each stage duration of the funnel obvious and actionable:
Funnel Chart With Time Labels
Standard funnel charts display a significant drop-off at each stage. It adds labels for the average time consumed in each stage to make the duration visible. This technique is best for showing bottlenecks.
Column Charts for Time per Stage
Vertical or horizontal bars can represent the average time in each stage. It clearly compares which stages take the longest time.
Flow Charts with Time Overlay
Flowcharts show lead movement, and overlaying time (using color, thickness, and labels) helps visualize both the path and delay. It is a decent approach for complex funnels or multiple paths.
Cohort Analysis Visualization
Use cohort charts with columns/stages to show how fast cohorts pass through the funnel. It highlights which source or group takes a long time in each stage of the funnel.
Read this: SaaS Sales Funnel Template – Get Your Free Funnel & Start Converting Today
Steps to Visualize Funnel Length with Time
Follow these steps to transform raw sales data into clear visuals that highlight how long each stage really takes.
Define Funnel Stages Clearly
The first step is to decide the stages of your funnel. You can use a common flow, such as awareness, interest, decision, action, or set custom stages. Keep them simple and meaningful.
Collect Time-Stamp Data
Secondly, you need to ensure your CRM tool records a lead when it enters and leaves each stage. Without exact timestamps, time visualization flops.
Choose Visualization Tools
In the third step, you are required to use the tool that checks both counts and time metrics. For that purpose, you can use tools like Looker Studio, Power BI, Amplitude, or custom dashboards.
Build Visuals with time metrics
Fourthly, you will combine funnel charts with time annotations and make bar charts for each stage duration. You need to try out several visual forms and pick the one that is most clear for you.
Review and Iterate Regularly
Lastly, you can track funnels at intervals (weekly, monthly). You can check how time changes, or whether optimisations are effective. You can adjust the stages accordingly to visualize the length of time for each funnel.
Common mistakes to avoid
The following are some common mistakes you must avoid in the above steps:
Missing or Inconsistent Timestamps
If stage transitions lack exact timing data, your visualisation is misleading. Therefore, you should fix timestamps consistently.
Too Many Funnel Stages
If there are too many funnel stages, the complexity increases, and the time comparison becomes unclear. Therefore, you should stick to the essential stages of the funnel only.
Focus Only On Leads
Many tracks in the sales funnel only count lead flow and ignore time metrics. This results in an increase in the length of time for sales funnel..
Key Takeaways
Pro Tip
Implement rolling time windows for funnel time visualization (e.g., 30-day or 90-day windows) instead of static historical averages.
How Can I Help You?
If you want to stop guessing and see how long your funnel stages cost you, my services help you set up proper time-based funnel visualizations. I will:


